Engagement is Complex
Engagement metrics are challenging because engagement is a spectrum of psychological intensity and is useful in broadly defining how active, interested, and committed people are. That vague general definition was fine – until we started trying to measure engagement. Measuring feelings is always a dicey business and depending on the methodology and tools used, the approaches vary wildly. Measurement techniques include observation, interviews, surveys, digital activity, and text analysis.
Measuring emotion is a bit of a fool’s errand and, in the end, it only impacts outcomes when it is expressed in behavior; I don’t know someone thinks something is funny until they laugh – and that laughter is likely to elicit a behavioral response in me. Similarly, the value of content does not change with the volume of people who see it. It is the application of content that changes and that has value. The content remains the same.
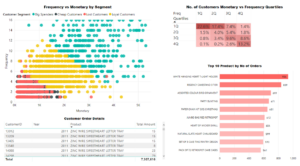
Because behaviors do not occur in isolation measuring one action in isolation doesn’t tell you much. The current state-of-the-art still calculates the volume of single behaviors or transactions. This RFM analysis model is the way many online retailers track activity and can use it to create automated prompts and drill down to see the transaction/buying history of each. That is helpful if you are a retailer but even then, experts would caution that “past performance is no guarantee of future results.” This type of data also does little to help us understand how behaviors change. More meaningful data would show what behavior patterns looked like for people who moved from one category to the next because then I could pinpoint what behavior I should make easier or harder and when in the behavior flow; THAT is how I could impact future potential.
Behavior Change Driven by Engagement Is What Matters
Measuring the value of collaboration, communication, and engagement inside organizations with a simplistic approach of counting typically makes engagement worse, not better; more content or transactions (emails, deliverables, and meetings) often makes it harder to do meaningful work. What is more interesting to know is how the best work is accomplished. It’s the sequence of behaviors – what behavior followed the last behavior – that is interesting. By comparing multiple groups can we learn something about what behavior sequences make a difference and then can we influence the trajectory of future behavior?
If you are a fan of economics, you know that the only way to change the economics of a system is by changes to behavior patterns. What that means in plain language is that changing how someone behaves is the only way a person, group, or organization will grow, adapt, become more effective, or produce more value. Behavior is the only thing that matters in understanding how to influence value or the employee experience.
Originally, I thought this was only an issue for community platforms but virtually none of our business software tracks behavior sequences across populations, which is curious.
The evolution of databases grew from mathematics, accounting, and engineering, not the social sciences. They originally were used to calculate numbers, not observe behavior.
The databases of large software platforms are still designed around counting content or transactions, not people and their behaviors.
Rachel Happe
We can tell you everything about the history of transactions or files and very little about the history of users as a group. This foundational issue with technology has sent the entire leadership world on a wild goose chase with little to show for it and a lot of complicated solutions yielding little strategic insight. We can’t even see if a platform is paying for itself by looking at its analytics. Organizations spend billions on technology annually and don’t really know which of it is effective. Mind-boggling.
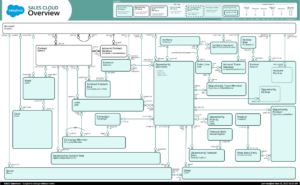
This data schematic from Salesforce helps to see this; the primary “parent’ data in its database is the Account, which if you are tracking past sales makes sense. However, it means that individual contacts are nested and not the primary identifier or organizing element and any transaction they have is then nested even further under each contact. That means I can go in and see the transaction pattern of each contact in isolation but it is more challenging to see the behavior flow of segments of people who share a common attribute.
New: Engaged Organizations’ Community Engagement Framework
Measuring engagement requires us to define how we will do so. Engagement itself is an emotional state, which eludes exact measurement but it impacts how we behave. We don’t speak up much if we are unengaged. We don’t ask questions when we feel vulnerable. We won’t offer alternative perspectives if we feel like we will be ignored, cause a problem or have it shot down. Defining and categorizing those behaviors is critical for measurement and are an effective proxy to understanding engagement in an objective way.
The Engaged Organization’s new Community Engagement Framework categorizes different types of engagement behaviors, bundles them into categories and relative value, defines the feelings each category of behavior reflects, and indicates the role of moderation and community management to shift those behavior patterns.
Capturing these behaviors and showing how they are shifting over time can help leaders identify how culture is shifting. No one system will ever capture all of this data but it can provide a meaningful sample, which can be used by managers and leaders to address issues.
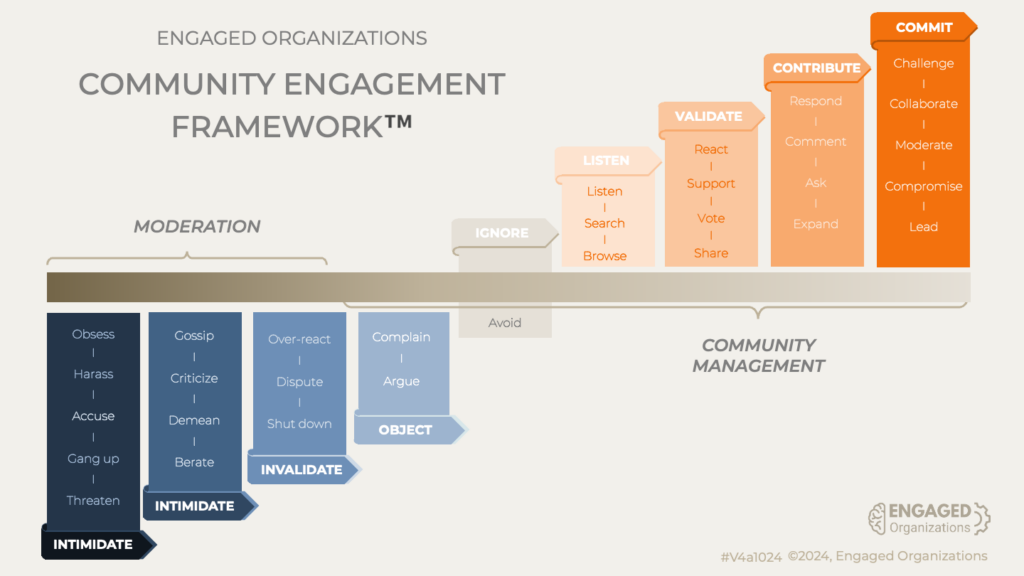
Monitoring how these behaviors shift can help us better understand how organizations and cultures work. Which behaviors repeat the most and how frequently? Are people comfortable asking questions? Seeing those behavior patterns provides a concrete and less murky analysis of how cultures operate. It provides both a benchmark and a way to identify opportunities to remove friction.
Once you can really SEE the mix and flow of behaviors, the real work can begin. A lot of things impact behavior; leadership, training, governance changes, new tools and technology, different incentives, and more. Hypothesis about what impacts behaviors can be tested. Does adding training make any meaningful difference? Does governance change have any influence? The impact and value will be self-evident – IF you can get the data.
Working transparently in networks, communities, and groups has one of the largest impacts on value because everyone has access to the latest information and everyone can operate in the same context. The payoff is so enormous that the investment in fostering that change would be self-evident – if we could see it.
Engagement Metrics Showing Self-Evident Value
So how do we SEE shift behavior and value What might a dashboard look like?
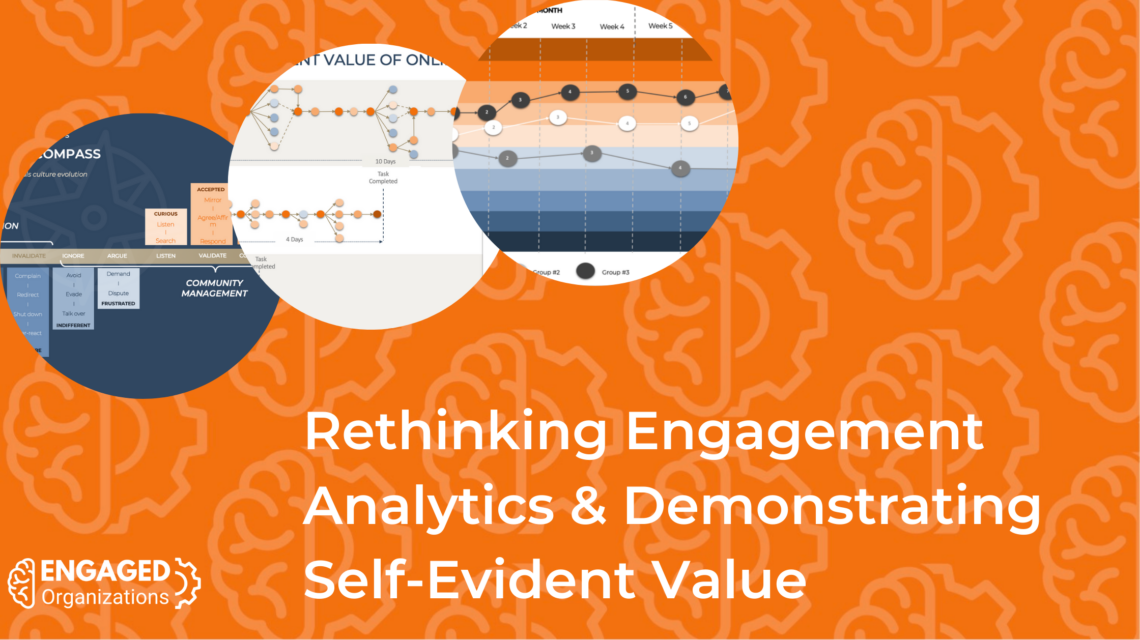
After years of thinking about this, I decided to design what I would most like to see in an engagement dashboard. This dashboard would show sequences of behavior over time and allow comparisons between segments. It would allow me to see where each behavior falls on the Engagement Compass and might allow me to toggle and see which behaviors represent a milestone. I would want to zoom in and out in time and toggle to compare different segments and trends over time.
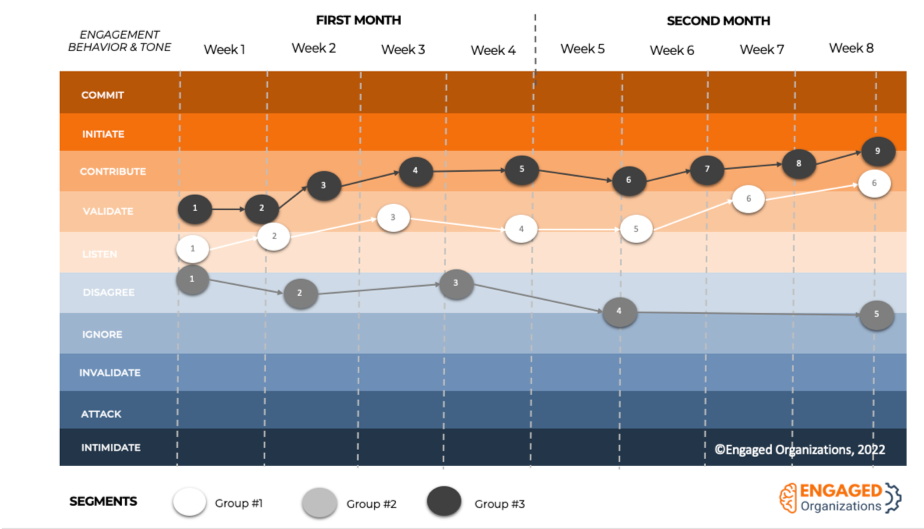
What I don’t need or want is the data for individuals, because surveillance and the punitive responses that come from it do not encourage the growth of positive behaviors. The best use of this data is to learn, adjust, test, and adapt environmental factors or to identify what the most successful groups are doing that could identify opportunities.
This dashboard would effectively highlight groups that:
- Increase and maintain constructive behaviors.
- Can effectively shift destructive behavior to a healthier state.
- Have the highest constructive engagement overall.
- Are the fastest at completing a workflow.
- Are fastest at moving between different milestones.
This information would make it easy to pinpoint issues, opportunities, best practices, and effective behaviors, which can then be encouraged and rewarded – and that is both meaningful and actionable.
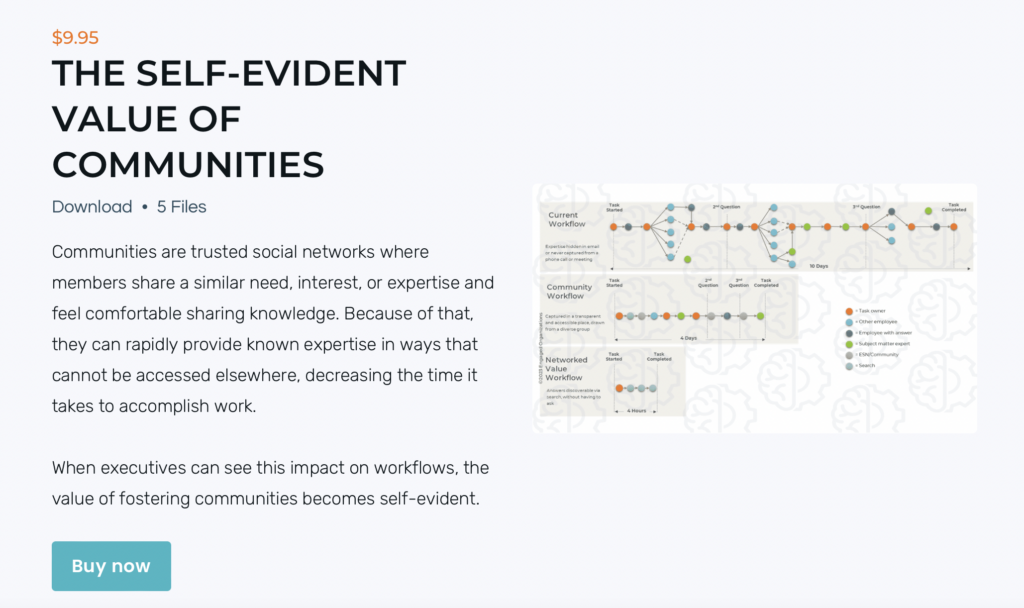
If you would like the image I have used for years to communicate the value of online communities by narrating the behavior changes and its implications, it is available in our Tool Shop.
Case Study: The Value of Tracking Behaviors
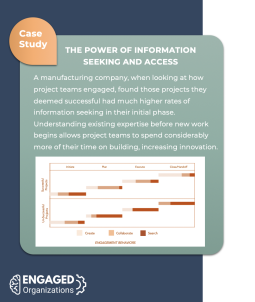
Working with a client, we developed a community-centric strategy targeted at increasing engagement and the depth of engagement on their social intranet. As part of that strategy, we identified three aligned ‘key behaviors’ that were both reasonable to expect based on past engagement (the next best step) and would help realize the strategy. One of them was asking questions. They undertook a research effort with an academic team to evaluate how often and when that behavior happened. They looked at what they considered successful and unsuccessful projects and analyzed how asking showed up in each set. The results were fascinating – and powerful.
They discovered that the most successful projects had very different behavior patterns. In successful projects, they saw a lot of questions in the first phase of the projects and much fewer in the subsequent three phases. In unsuccessful projects they saw the reverse; few questions in the beginning and more and more as the project went on. This case study comes from the Digital Workplace Communities in 2021 report.
Interesting, isn’t it?
What’s Next?
Have you seen data that shows this type of behavior sequence? Does it make sense to you? Does it spark other insights?
Have you looked at your engagement behavior this way? What did you learn?
I would love to hear from you if you would like to discuss this topic; please reach out!


